Game totals are one of the toughest markets to bet on in sports. The numbers are typically very sharp. Today I want to go through my approach to betting on game totals, and some of the tools that Pine has to offer, to aid you in this research process.
(I use this approach for all leagues when I am looking at game totals, but the examples given will be taken from the MLB since it is the only active sport right now that I bet on)
So let’s start from the beginning, every week I start off by trying to get a picture of how each team is trending, whether they are playing to the over or the under.
I do this by going to the explore page on Pine Sports, and set up a search to analyze team stats that loo that look like this.
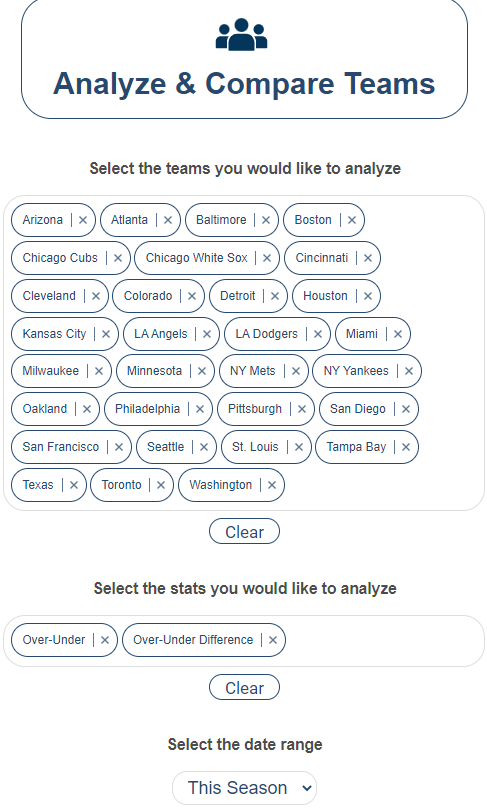
From this search, it will bring up a chart that looks like this.
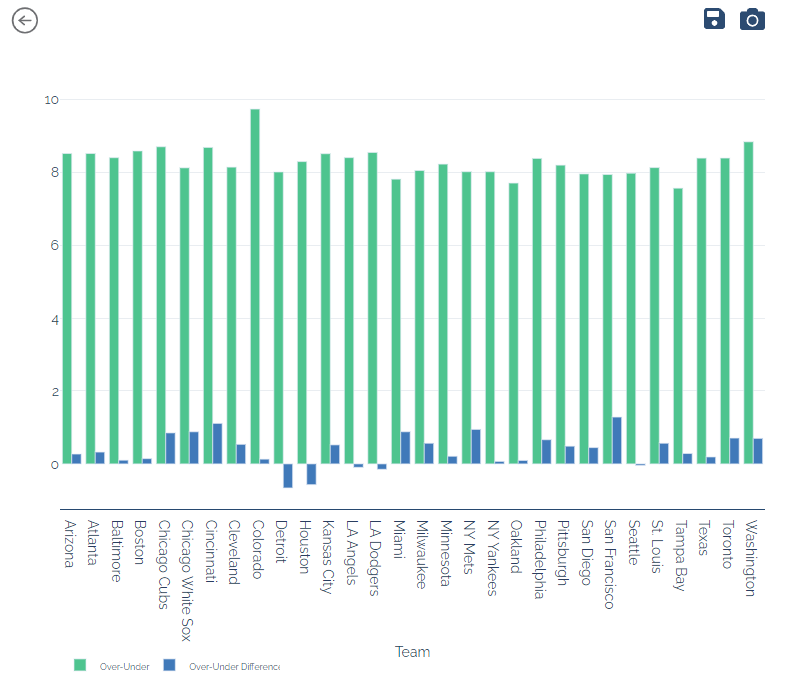
In this chart, the green bar represents the average game total for each team, and the blue bar represents the average deviation from that total.
For example, the San Francisco Giants average total is 7.93 runs, and on average, they are going over that total by 1.28 runs.
Now, having that one piece of data is convenient to know, but on its own, it doesn’t paint the best picture. However, you can run this same search on Pine Sports, but with a different time frame to get a better picture of how a team is trending totally.
Typically, I like to run the search and take the numbers from….
The Entire Season
The Last Month
The Last Week
This is when you start to see trends of how teams are currently playing against the total. But let’s stick with the SF Giants example, and look at the data from the month of June for this year's MLB season.
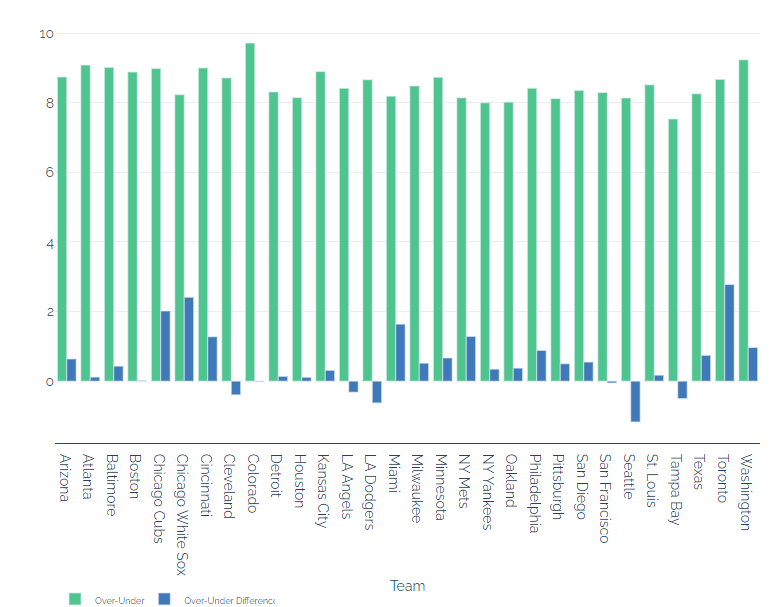
Now from this chart, we can see the runs cooled off in Giants games in the month of June. The Giants average game total was 8.29 throughout June, but in those games on average games went under by -0.05 runs.
On the year, the Giants have been one of the best teams to the over, as I demonstrated in the first chart above, however when you compare these two, it shows inconsistencies, which is why I also like to take the data from the last week to get the most recent picture of how a team is playing, so let’s look at that data as well.
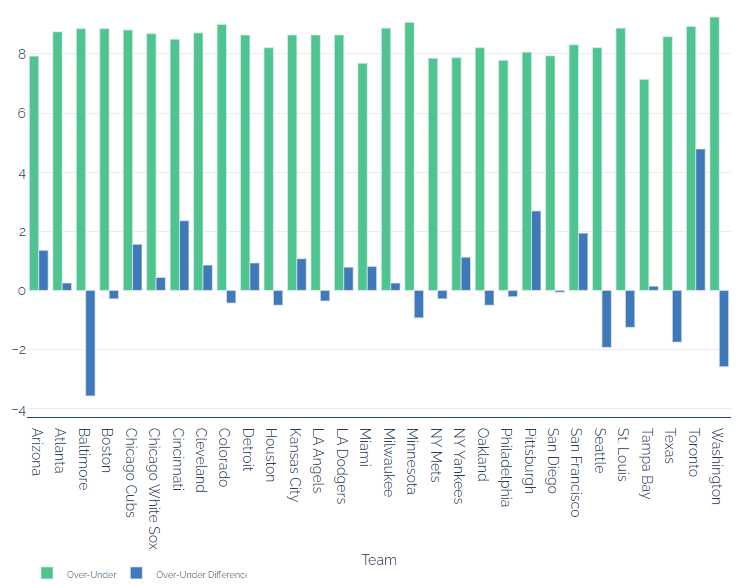
Now from this last week of MLB games, we can see that the SF Giants have once again started to play to the over. Throughout their last week of games, their average game total was 8.31 and in those games the total went over by an average of 1.93 runs.
Now, if we put all of these numbers beside each other to compare…
2022 Season - Game Total: 7.93 / Differential: +1.28
Last Month - Game Total: 8.29 / Differential: -0.05 Runs
Last Week - Game Total: 8.31 / Differential: 1.93 Runs
From this, we can see that the Giants are a team that has consistently been playing to the over all season. However, in recent weeks their games have been very sharp to the total, excluding this last week, showing that the Giants might be getting back into the over trend, but I don’t like to put a lot of weight just on this past week's numbers.
I find that looking at just the past week, the numbers can be slightly skewed based on who a team has played, or different pitching matchups and so on. I find that the last week should be used more to support your evidence from the other two data sets, rather than being the primary source.
Not to say that the Giants aren't a good team to target for an over in specific matchups, but with these trends I would want to know that their opponent has been playing to the over as well, to mitigate some of the inconsistencies with the Giants recent trend of unders before this past week.
In an ideal world, we want all three data sets trending in the same direction.
For example, let's look at the numbers for the Toronto Blue Jays this season.
2022 Season: Over/Under: 8.38 Differential: +0.70
The Last Month - Over/Under: 8.67 Differential: +2.77
The Last Week - Over/Under: 8.92 Differential +4.78
(Numbers taken from charts above)
When you look at these numbers you see a clear pattern trending towards the over. The Blue Jays have been lighting it up offensively recently, and their pitching has fallen off a cliff, which I think has led to this spike. However, this is one of the teams that we should consistently look to play overs on.
For example, The Toronto Blue Jays are…
39-32-1 to the over this season, 8.44% ROI.
9-1 to the over, over their last 10 games, 74.18% ROI
5-0 to the over, over their last 5 games, 93.46% ROI
On the year, the Blue Jays are the 4th most profitable team to the over in the MLB. This is the consistency I am looking for when looking at betting on game totals.
But there aren't that many teams as consistent as the Blue Jays are to either the over or the under, but there are a few. These are the specific trends that I am looking to mark down for the betting week ahead, so I can already have targets circled on a daily basis.
This isn’t a strategy for making picks, but more or less a way for me to get a landscape of the league on a weekly basis. All sports totals go through volatile swings of more overs or unders cashing, I think it is important to know how scores are trending across the league, before going and betting on a total. You don’t want to be betting overs when all kinds of unders are coming in and vice versa.
Next week on the School of Pine, I want to dive deeper into how you can analyze totals, and how you can further understand why a team is trending in a positive or negative direction.
Game totals are one of the toughest markets to bet on in sports. The numbers are typically very sharp. Today I want to go through my approach to betting on game totals, and some of the tools that Pine has to offer, to aid you in this research process.
(I use this approach for all leagues when I am looking at game totals, but the examples given will be taken from the MLB since it is the only active sport right now that I bet on)
So let’s start from the beginning, every week I start off by trying to get a picture of how each team is trending, whether they are playing to the over or the under.
I do this by going to the explore page on Pine Sports, and set up a search to analyze team stats that loo that look like this.
From this search, it will bring up a chart that looks like this.
In this chart, the green bar represents the average game total for each team, and the blue bar represents the average deviation from that total.
For example, the San Francisco Giants average total is 7.93 runs, and on average, they are going over that total by 1.28 runs.
Now, having that one piece of data is convenient to know, but on its own, it doesn’t paint the best picture. However, you can run this same search on Pine Sports, but with a different time frame to get a better picture of how a team is trending totally.
Typically, I like to run the search and take the numbers from….
The Entire Season
The Last Month
The Last Week
This is when you start to see trends of how teams are currently playing against the total. But let’s stick with the SF Giants example, and look at the data from the month of June for this year's MLB season.
Now from this chart, we can see the runs cooled off in Giants games in the month of June. The Giants average game total was 8.29 throughout June, but in those games on average games went under by -0.05 runs.
On the year, the Giants have been one of the best teams to the over, as I demonstrated in the first chart above, however when you compare these two, it shows inconsistencies, which is why I also like to take the data from the last week to get the most recent picture of how a team is playing, so let’s look at that data as well.
Now from this last week of MLB games, we can see that the SF Giants have once again started to play to the over. Throughout their last week of games, their average game total was 8.31 and in those games the total went over by an average of 1.93 runs.
Now, if we put all of these numbers beside each other to compare…
2022 Season - Game Total: 7.93 / Differential: +1.28
Last Month - Game Total: 8.29 / Differential: -0.05 Runs
Last Week - Game Total: 8.31 / Differential: 1.93 Runs
From this, we can see that the Giants are a team that has consistently been playing to the over all season. However, in recent weeks their games have been very sharp to the total, excluding this last week, showing that the Giants might be getting back into the over trend, but I don’t like to put a lot of weight just on this past week's numbers.
I find that looking at just the past week, the numbers can be slightly skewed based on who a team has played, or different pitching matchups and so on. I find that the last week should be used more to support your evidence from the other two data sets, rather than being the primary source.
Not to say that the Giants aren't a good team to target for an over in specific matchups, but with these trends I would want to know that their opponent has been playing to the over as well, to mitigate some of the inconsistencies with the Giants recent trend of unders before this past week.
In an ideal world, we want all three data sets trending in the same direction.
For example, let's look at the numbers for the Toronto Blue Jays this season.
2022 Season: Over/Under: 8.38 Differential: +0.70
The Last Month - Over/Under: 8.67 Differential: +2.77
The Last Week - Over/Under: 8.92 Differential +4.78
(Numbers taken from charts above)
When you look at these numbers you see a clear pattern trending towards the over. The Blue Jays have been lighting it up offensively recently, and their pitching has fallen off a cliff, which I think has led to this spike. However, this is one of the teams that we should consistently look to play overs on.
For example, The Toronto Blue Jays are…
39-32-1 to the over this season, 8.44% ROI.
9-1 to the over, over their last 10 games, 74.18% ROI
5-0 to the over, over their last 5 games, 93.46% ROI
On the year, the Blue Jays are the 4th most profitable team to the over in the MLB. This is the consistency I am looking for when looking at betting on game totals.
But there aren't that many teams as consistent as the Blue Jays are to either the over or the under, but there are a few. These are the specific trends that I am looking to mark down for the betting week ahead, so I can already have targets circled on a daily basis.
This isn’t a strategy for making picks, but more or less a way for me to get a landscape of the league on a weekly basis. All sports totals go through volatile swings of more overs or unders cashing, I think it is important to know how scores are trending across the league, before going and betting on a total. You don’t want to be betting overs when all kinds of unders are coming in and vice versa.
Next week on the School of Pine, I want to dive deeper into how you can analyze totals, and how you can further understand why a team is trending in a positive or negative direction.
Share your best bets!