The Home Run Derby is tonight so I jumped on Pine to do some research. I pulled up some key numbers, ran some Monte Carlo simulations, and here's what I found...
I first looked at each player's total home runs this season and total at bats.
I then looked at the average "Park Factor - Home Run" for each player this season.
This got me the home run % per at bat for each player as well as whether, on average, they were in stadiums that were easier or harder to hit home runs in. Here's a chart with all this info:
| Seed | Batter Name | HR/AB | HR/AB % | Avg PF-HR | Adj. HR/AB% |
| 1 | Kyle Schwarber | 29/336 | 8.63% | 98.6889 | 8.70% |
| 2 | Pete Alonso | 24/334 | 7.19% | 98.6522 | 7.25% |
| 3 | Corey Seager | 22/346 | 6.36% | 98.4545 | 6.42% |
| 4 | Juan Soto | 20/312 | 6.41% | 103.0769 | 6.18% |
| 5 | José Ramírez | 19/330 | 5.76% | 103 | 5.55% |
| 6 | Julio Rodriguez | 16/346 | 4.62% | 98.0989 | 4.68% |
| 7 | Ronald Acuña Jr. | 8/230 | 3.48% | 102.9492 | 3.36% |
| 8 | Albert Pujols | 6/149 | 4.03% | 90.18868 | 4.41% |
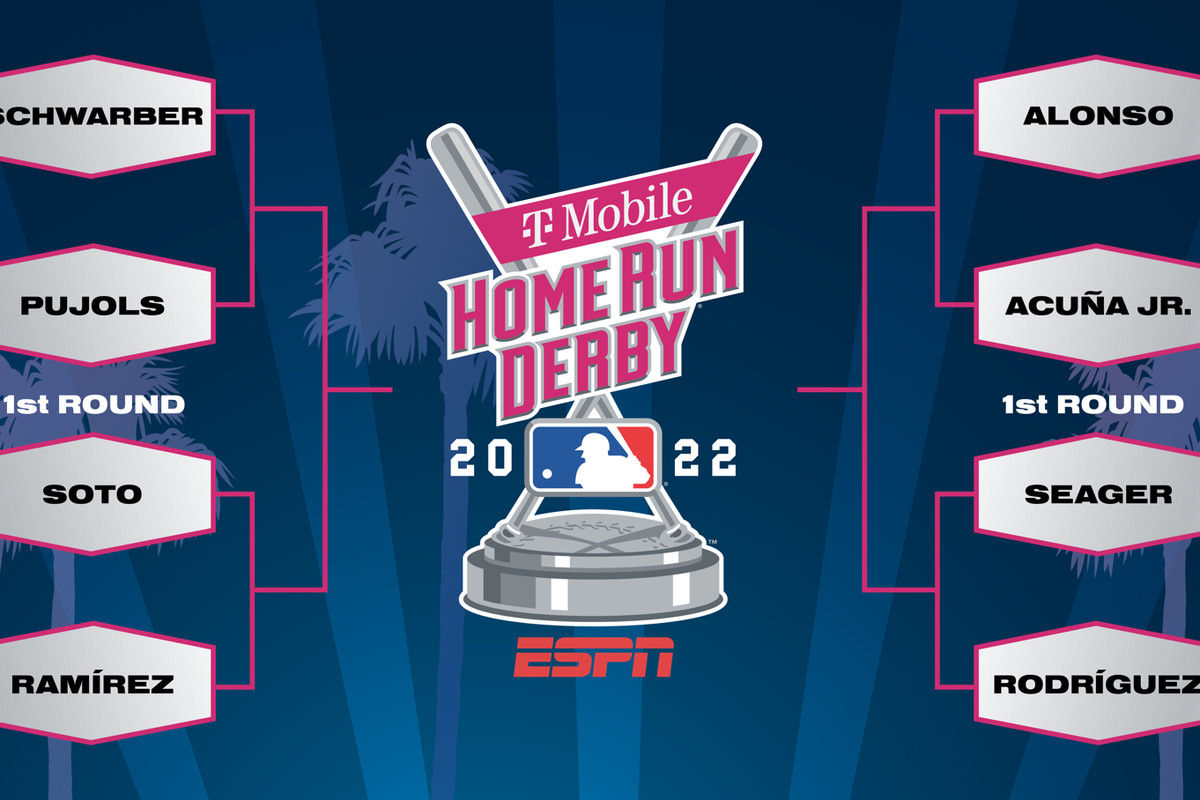
As you can see, the seedings are relatively good, with the potential exception of Albert Pujols who could be 7th seed. Armed with these percentages, I did a Monte Carlo simulation (simulating 100 pitches with these HR rates) where each bracket was played 10,000 times. Here's what I got:
No. 1 Kyle Schwarber vs. No. 8 Albert Pujols
Kyle Schwarber won 8571 times (91.3%)
Albert Pujols won 816 times (8.7%)
No. 2 Pete Alonso vs. No. 7 Ronald Acuña Jr.
Pete Alonso won 8591 times (91.7%)
Ronald Acuña Jr. won 778 times (8.3%)
No. 3 Corey Seager vs. No. 6 Julio Rodriguez
Corey Seager won 6534 times (73.11%)
Julio Rodriguez won 2403 times (26.89%)
No. 4 Juan Soto vs. No. 5 José Ramírez
Juan Soto won 5179 times (58.72%)
José Ramírez won 3641 times (41.28%)
No. 1 Kyle Schwarber vs. No. 4 Juan Soto
Kyle Schwarber won 7092 times (77.64%)
Juan Soto won 2043 times (22.36%)
No. 2 Pete Alonso vs. No. 3 Corey Seager
Pete Alonso won 5344 times (60.04%)
Corey Seager won 3557 times (39.96%)
No. 1 Kyle Schwarber vs. No. 2 Pete Alonso
Kyle Schwarber won 6016 times (66.42%)
Pete Alonso won 3041 times (33.58%)
This is just a rough estimate. Hope it helps! It does match the Pine Parlay of the Day... BOL!!
The Home Run Derby is tonight so I jumped on Pine to do some research. I pulled up some key numbers, ran some Monte Carlo simulations, and here's what I found...
I first looked at each player's total home runs this season and total at bats.
I then looked at the average "Park Factor - Home Run" for each player this season.
This got me the home run % per at bat for each player as well as whether, on average, they were in stadiums that were easier or harder to hit home runs in. Here's a chart with all this info:
As you can see, the seedings are relatively good, with the potential exception of Albert Pujols who could be 7th seed. Armed with these percentages, I did a Monte Carlo simulation (simulating 100 pitches with these HR rates) where each bracket was played 10,000 times. Here's what I got:
No. 1 Kyle Schwarber vs. No. 8 Albert Pujols
Kyle Schwarber won 8571 times (91.3%)
Albert Pujols won 816 times (8.7%)
No. 2 Pete Alonso vs. No. 7 Ronald Acuña Jr.
Pete Alonso won 8591 times (91.7%)
Ronald Acuña Jr. won 778 times (8.3%)
No. 3 Corey Seager vs. No. 6 Julio Rodriguez
Corey Seager won 6534 times (73.11%)
Julio Rodriguez won 2403 times (26.89%)
No. 4 Juan Soto vs. No. 5 José Ramírez
Juan Soto won 5179 times (58.72%)
José Ramírez won 3641 times (41.28%)
No. 1 Kyle Schwarber vs. No. 4 Juan Soto
Kyle Schwarber won 7092 times (77.64%)
Juan Soto won 2043 times (22.36%)
No. 2 Pete Alonso vs. No. 3 Corey Seager
Pete Alonso won 5344 times (60.04%)
Corey Seager won 3557 times (39.96%)
No. 1 Kyle Schwarber vs. No. 2 Pete Alonso
Kyle Schwarber won 6016 times (66.42%)
Pete Alonso won 3041 times (33.58%)
This is just a rough estimate. Hope it helps! It does match the Pine Parlay of the Day... BOL!!
Change your outcomes.
Use Me.